Now, here’s a fascinating chart.
Really, even though it takes a moment absorb, it speaks a novel’s worth about where we are right now.
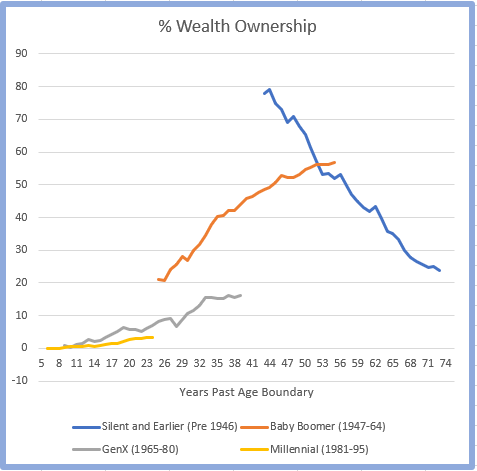
The data comes from the Federal Reserve, and shows how much of the country’s wealth has been owned by each generation over time. I found it because it’s a moderately popular link being passed around on my social feeds, and it seems important to me because it addresses what people really mean when they say the economy is not working.
Aside: if you are a boomer, like I am, you really need to take a deep breath and wade into this. The economy is not the stock market, after all, and the stock market is not the economy. Being oblivious to this is an actual problem, and the fact is that it would be good if you were aware of what is really happening. When you hear a “kid” say Okay, Boomer, they are addressing that oblivion in the same way that “check your privilege” is a bit of a time worn way to let us white guys know our ass is showing, and that it really isn’t a good look. I suppose that’s why Okay Boomer is being received as it is, though. No one enjoys being exposed as being oblivious, especially when that exposure hits the mark.
Anyway.
Here’s the chart.
First, Methods and Issues
I took the Federal Reserve data and re-staged it to display how situations have changed for each generation over each year of their existence. I used the last birth year of their category as a starting point, then plotted the data as each generation grew older. Note: given the source starts in 1989, the Silent Generation was 43 years closed when the chart begins, meaning people in that group were 43 years old or older. Similarly, the Boomer generation was 25 years past its close date in 1989, so this group was between 25 and 42 when the chart starts for them. After that, each age group is a 15-year band that marches through time.
Since the age spans are different numbers of years, the population in each group will vary. The data should be adjusted for this stuff to be more precise, but at the end of the day, I don’t think those adjustments will change the base story.
I say that because, holy crap, look at the base story…
The Point of “Okay, Boomer.”
Take a few moments and look at this chart. I mean, especially if you are a Boomer. Take some time to think about it.
Look, for example, at the Boomer and Silent Generation curves and remember back to how it felt when we were twenty-five and thirty—because the fact of the matter is that we had the same problem happening to us as Gen-Xers and Millenials have happening to them now. The effect was less severe because we were the first in line, and because growth was so large. But if you’ll recall, privileged or not, building that beachhead wasn’t easy. This chart might give you insight as to why.
Look where the Silent Generation starts. At the end of 1989, 43 years past the close of their definition date, the Silent Generation owned 78% of the country’s wealth.
When the Baby Boomer generation was 43-years-closed (2007), we owned “only” 48% of the country’s wealth. That’s still a lot, relative. We were doing all right, I suppose. People like me were managing to build a pretty good life, anyway, though I’ll note there are Boomers who were struggling (and still do). Note, too, that when the Silent Generation was 43 years closed their wealth ownership was falling dramatically. Us Boomers were just getting started, though—and, in fact, at 55 years past close, we’re still adding to our wealth, thank you very much.
Compare that to the wealth accumulation for Gen-X. They are currently 39 years past the date when the last of their members were born. They own 16% of our country’s wealth. At that point of our Boomer group’s life span, we owned 44%. This is a very, very big difference (even bigger than the gap between us Boomers and our Silent Generation parents), hence a very big deal—especially when you compare the Millennial accumulation curve relative to that of the Gen-Xer, and see the dynamic is repeating itself with what appears to be something close to fractally perfect symmetry.
That’s how a lot of systems work, after all.
So, no. The American economy is not working for generations after my Boomer class.
At all.
And—to remind—it didn’t really work well for us Boomers.
Another aside: I recall a fairly boisterous conversation I had with a compensation professional while I was employed in corporate America. He was quite taken back when I explained how their system of paying employees through an alchemetric array of methods that include seniority, faux merit, and the odd concept that in order to get paid market value, you have to leave your place of employment meant that I and several of my co-workers were severely underpaid throughout most of our productive lives, and that this resulted in our current net worth being literally hundreds of thousands of dollars short of where they should be in a properly compensated world. “You don’t want to plateau a younger guy,” the professional replied at one point—which, unless you step back and think about it, you’re likely to miss as being corporate codespeak to justify not paying people what they are actually worth.
In other words, the economy hasn’t worked well for future generations during the entire span I’ve been an adult. I’m tempted to point out the Reagan era tax shenanigans are likely where the problems originated, but this chart isn’t good enough to say that for sure…that said, there are other data sources that seem to consistently point to 1980-1982 as an inflection point for several other inequality oriented data sets, so read that as you will.
At the end of the day, though, my Boomer generation was saved by growth. Yes, relative to our parents, we had less of the pie but the pie was considerably bigger. We could make it work.
That’s no longer the case. At least not to anything close to the same degree it was in our younger days. As Andrew Yang has been saying recently, and as futurists have been saying for some time, this is not your dad’s economy.
Several things worth thinking about are embedded in this chart somewhere, too.
For example: Where is the 1%?
Discounting a billionaire or two, I think it’s fair to guess the 1% is almost all in the Silent Generation and Baby Boomer categories. Think about how that influences these curves.
And I’d question how gender and ethnic splits fall out. Our country’s demographics are changing, after all. The younger generations have always grown more diverse, and this almost certainly has a ramification here. And what about the effect of increased life spans. The fact that wealth accumulates longer for us Boomers is likely because—at least until recently, we’ve lived longer and been able to work longer.
You can add more. At the end of the day, though, this chart is clear in its depiction of the idea that my daughter’s generation (she was born square in the middle of the Millennial range) is facing a substantially different world than I faced at the same age. Spending power is totally different. The job market is significantly different. The ability to save and invest, and hence grow long-term wealth is, relative to the generation that I lived in, essentially gone.
And, so…
When I see my Boomers get bothered by the “Okay, Boomer” thing I admit to conflicting feelings, the first being that I get it.
I’m a guy of a certain age, and a white guy to boot.
I know how hard it is to have this kind of truth brought up. Your first defense is to laugh and dismiss it as fanciful dross put forward by whining idiots. Then, when it doesn’t go away, you feel challenged, and then, when you fight it, bludgeoned. You want to tell people to just shut up and go away. Still, though, truth is truth, and eventually, when you’re ready to see it, you see it. And when you finally accept it, you’re left with trying to process the fallout—which can be a complicated matter all by itself.
Like I said before, no one enjoys having their obliviousness exposed.
The ultimate answer is eventually and simply this: It’s time to put your adult pants, skirts, kilts, or whatever on and stop taking things like this so damned personally. This is a systemic issue, not an individual one. Neither you nor I, my Boomer buddy, did this by ourselves. The fact that you and I are members of what is essentially the last group to be living in a financial bubble of some relative comfort isn’t in itself a problem unless you try to pretend otherwise.
The problem, however—the root of the whole Okay Boomer thing—is that we as a group, and the political world we’ve built around us, is doing exactly that. Pretending otherwise.
When looked at through this lens, the Trump corporate tax cuts were literally the worst thing that could be done. Of course, the other sides aren’t that much better. Corporate America is all-in to make this worse. American financial institutions are in similar states. Despite this chart arguably showing the reason we need it, the entire argument about health care reform is essentially oblivious to this situation. Even the most progressive politicians in the modern day mix don’t seem to be totally getting it, though the Sanders/AOC democratic socialists almost get there, and the Warren conversations are close, too … and then there’s Yang, who is probably closest to the raw financial side of this.
What do I know, though?
I’m just a guy who looks at data in weird ways to avoid writing the SF novel I’m supposed to be working on, right?
All I can say with any certainty is that while some folks talk about climate change as an existential issue for the planet, and while those people are almost certainly right, this chart most likely describes the core of what is an existential issue for our country—or at least for our fundamental standard of life. If our public and politicians don’t see this and don’t make some changes, I can’t imagine we’re going to see anything but further degradation in future. And when that happens … well … instabilities like that have a history of being uncomfortable.
As another aside, my mom recently made an off-hand comment about her generation ruining things when it came to climate change, which was, admittedly a bit of a shock to me. Still, my response was to nod and say, sure, but at least they had the benefit of not really knowing what they were doing. It was really my generation that understood and did nothing.
This is a similar thing going forward.
Just like climate scientists have been warning of environmental issues for decades, economists and futurists have been warning about this for a long time. Income inequality and disproportionate accumulation of wealth is the most pressing social issue we have today. Yes, the stock market is still “strong” even if it’s unreliable in the short term.
But, unless you are a Boomer today, our economy is not working like a lot of us Boomers think it is.
It would be better for everyone if we all understood that.